
This year’s Greatest Grand Tour of a Mythical Country in the Whole Wide World,” an event put on by The Sufferfest, was so very much fun! In my role as statistician this year, I provided ongoing updates and a wrapup infographic.
The updates, posted daily, were wrapped in R’s flexdashboard tool and leveraged both the ggplot2 and plot.ly libraries, and run over The Sufferfest’s MongoDB data assets.
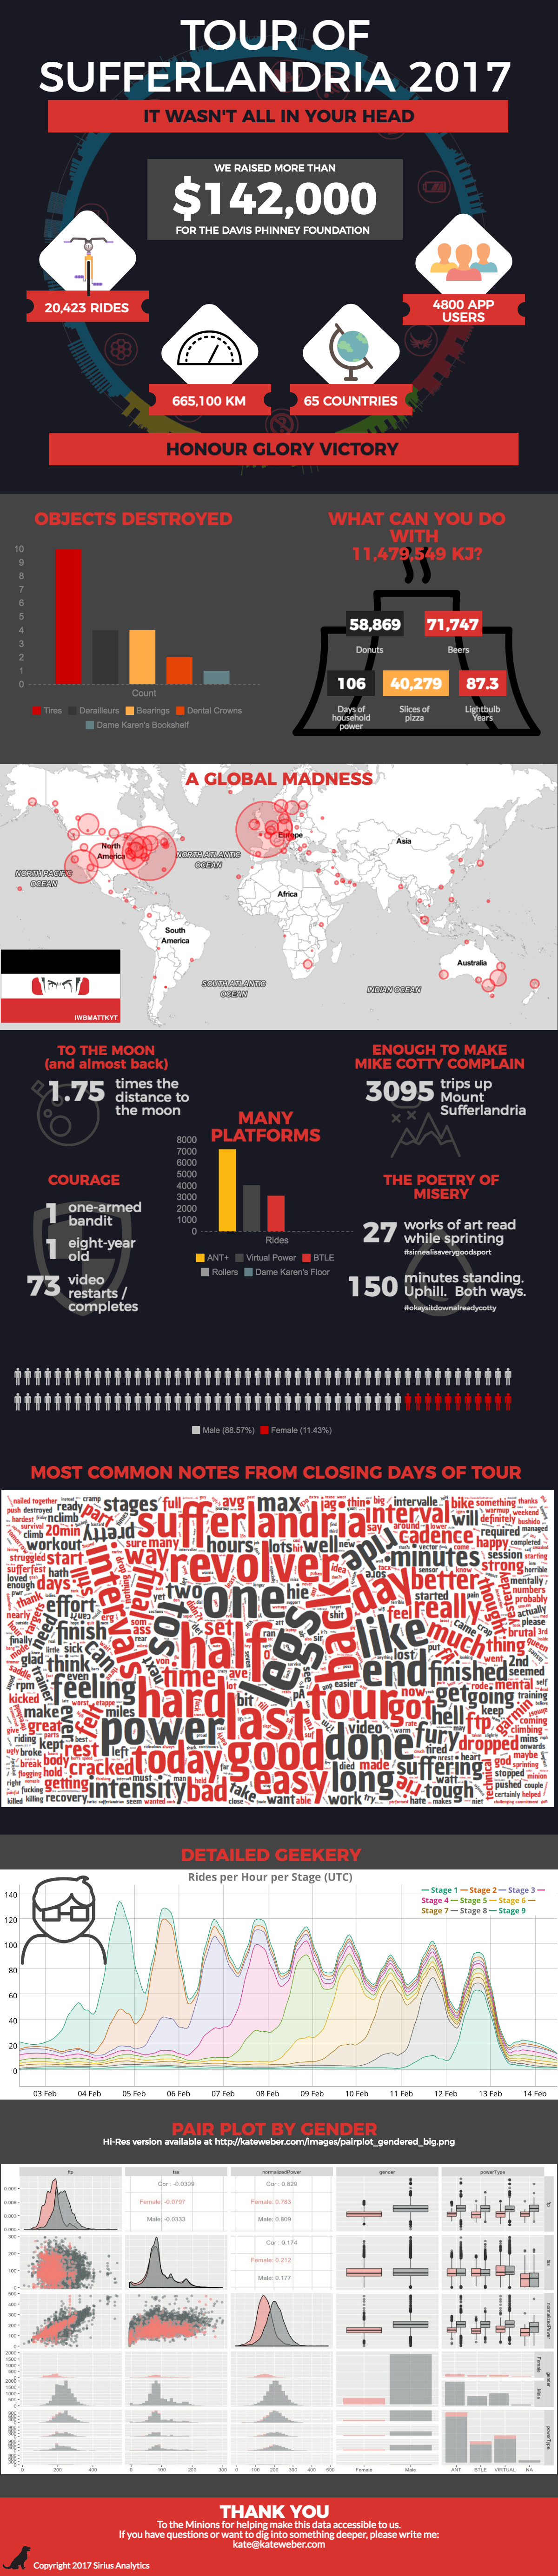
For the final wrapup, I built an infographic that was carefully targeted at the participants’ sense of community and accomplishment.
We’re doing ongoing analysis with The Sufferfest to investigate whether participation in the Tour impacts ongoing subscription rates and athletic performance; and working with pattern and motif recognition tools to find athletes who appear to be following a training plan.