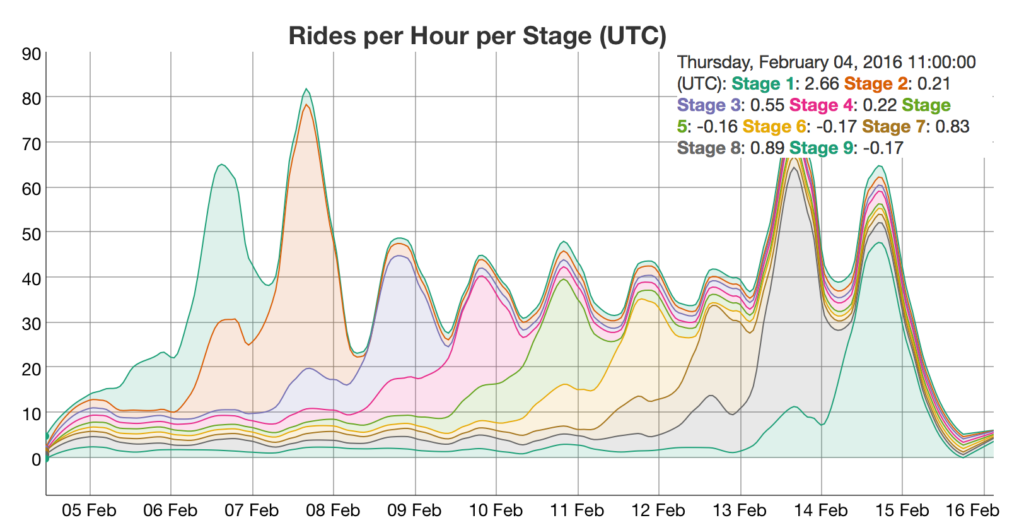
An overview of a virtual cycling race, helping riders understand how much effort they expended; how this international event unfolded over time; and comparing their efforts to others’. I also took an exploratory look at how event participants’ post-event performance compared to those of people who had not taken part. This deserves more investigation.
Data sourced from http://www.trainerroad.com via python scripting, processed in R, published via shinyapps.io

