Needle in a Haystack

This visualization shows a newly-discovered dwarf planet, “DeeDee” as it appears in the sky through three years of surveys by the Dark Energy Camera.  Each grey pixel is an object that was spotted on one night – the red dots are the points that were sifted out of this information and analyzed to confirm DeeDee’s position and orbit.

The data was imported into R and built into this animation using ggplot2 and gganimate.

http://kateweber.com/flyingrocks/animation-once.gif

Tour of Sufferlandria 2017

This year’s  Greatest Grand Tour of a Mythical Country in the Whole Wide World,” an event put on by The Sufferfest, was so very much fun! In my role as statistician this year, I provided ongoing updates and a wrapup infographic.

The updates, posted daily, were wrapped in R’s flexdashboard tool and leveraged both the ggplot2 and plot.ly libraries, and run over The Sufferfest’s MongoDB data assets.

For the final wrapup, I built an infographic that was carefully targeted at the participants’ sense of community and accomplishment.

We’re doing ongoing analysis with The Sufferfest to investigate whether participation in the Tour impacts ongoing subscription rates and athletic performance; and working with pattern and motif recognition tools to find athletes who appear to be following a training plan.

Wrangling the Open Street Map

In this project, I dumped Open Street Map (OSM) data from the area around Ann Arbor and analyzed it for patterns.  After doing basic statistical review of the data set, I started looking for patterns and outliers.

The data set , unfiltered and unlabeled, creates a compelling image that makes the difference in land-use policy between my county and the neighboring counties (part of suburban Detroit) obvious (click to embiggen):

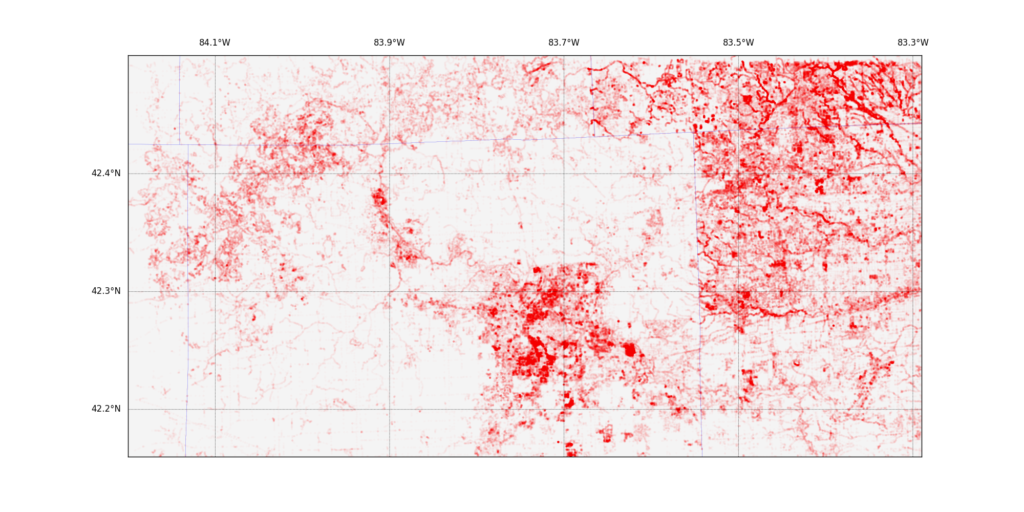
The red blob in the middle is the very densely populated part of Ann Arbor, surrounded by lots of rural land, right up to the borders with Wayne and Macomb counties.  I did more analysis and decided to reshape the data to emphasize the number of edits any given pixel had had and discovered this:

blue

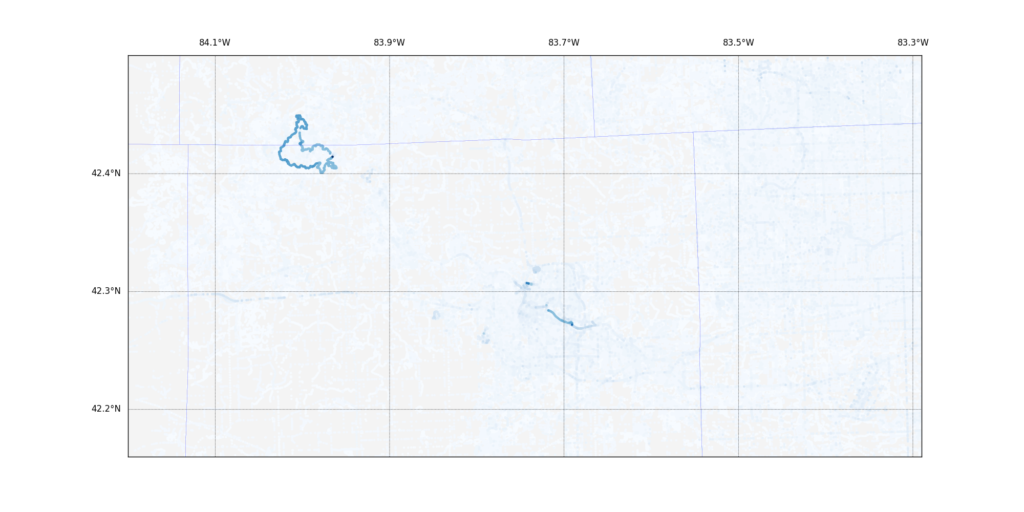
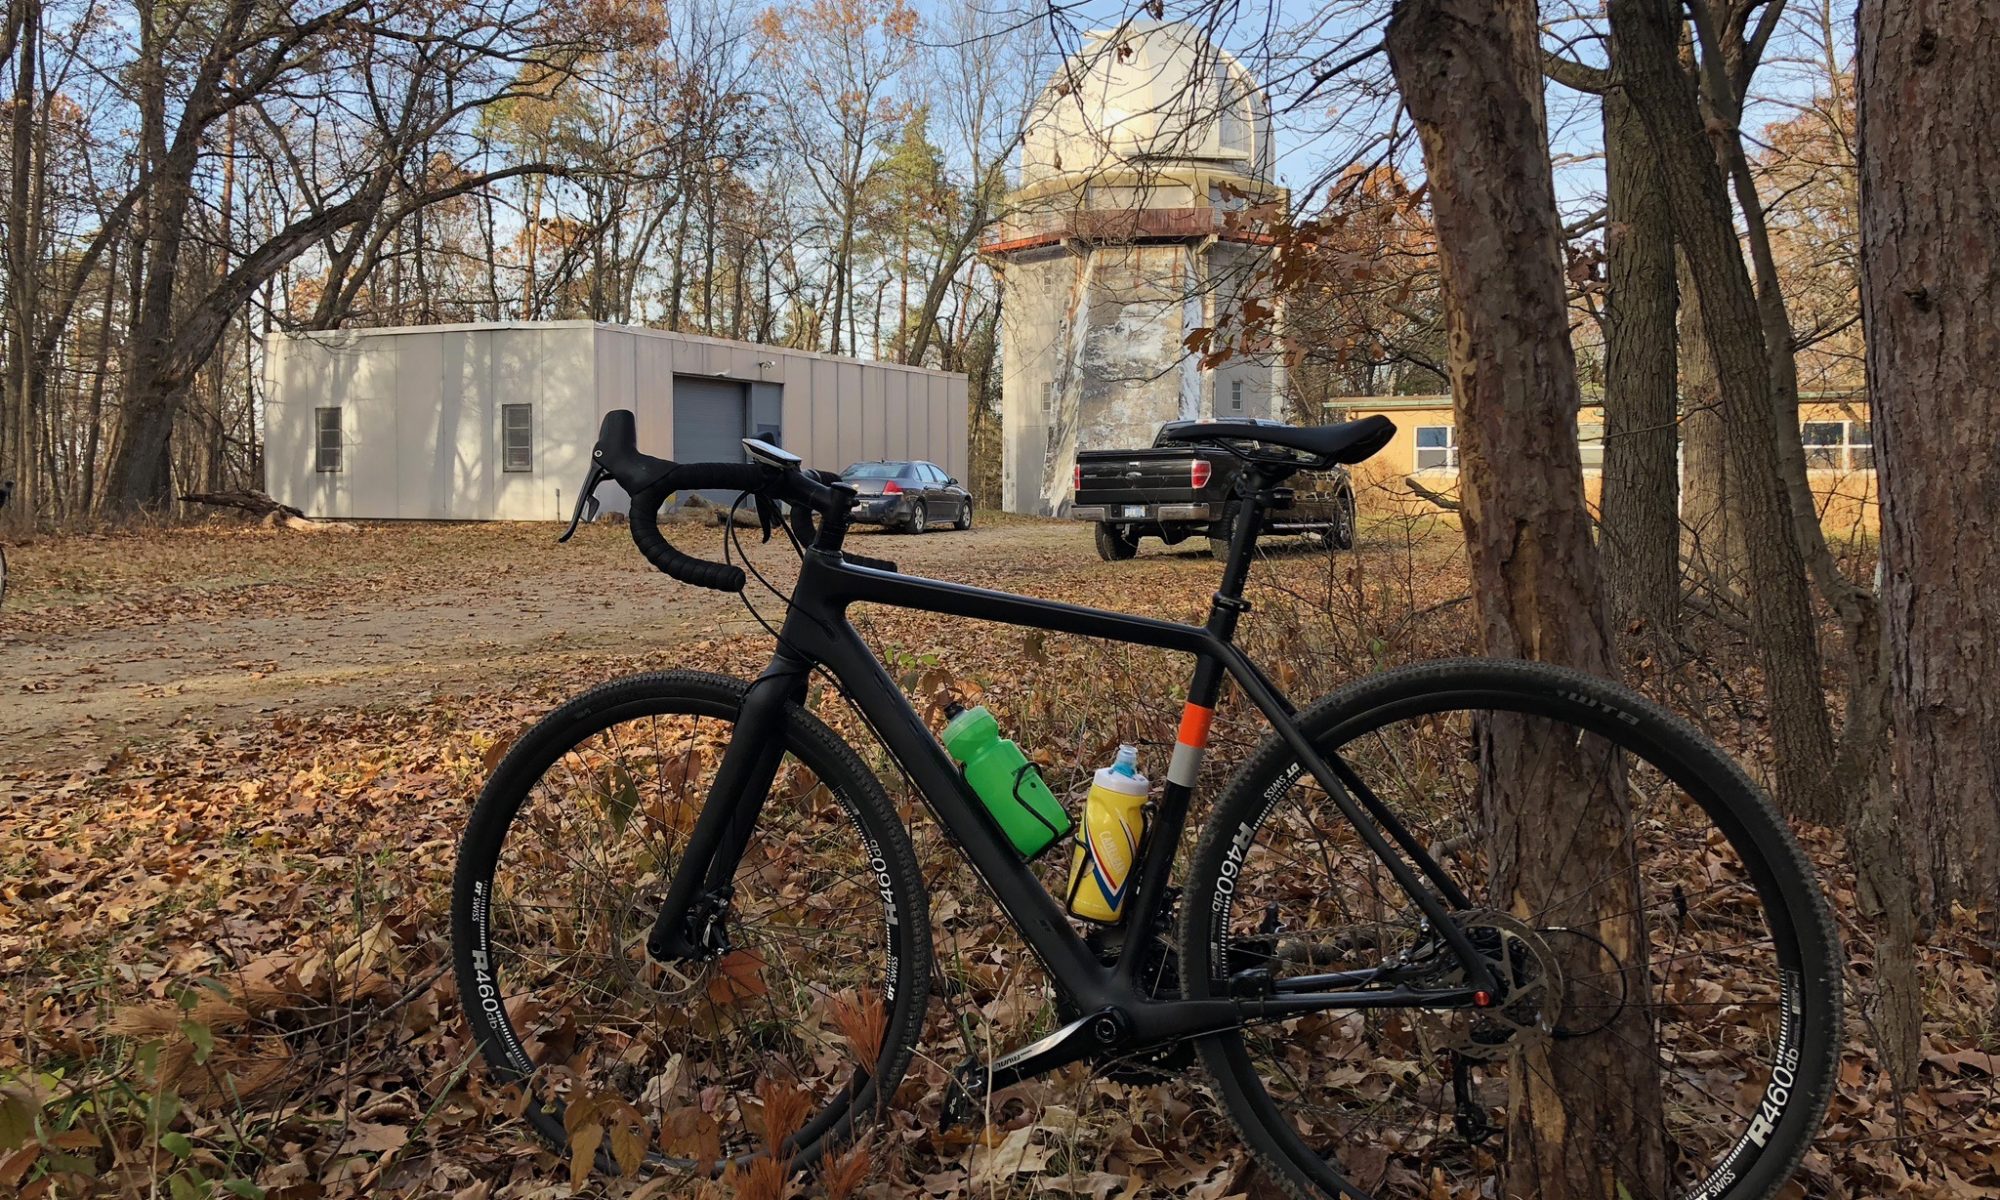
I had expected to see much more density in the heart of Ann Arbor as the busy city maps were continually updated, but instead, a 17-mile cycling trail popped out. The paper digs into this a little further.

http://kateweber.com/portfolio/ProjectReport.html

Reviewing Beer Reviews

Beer Styles, Rated

This was a fun project – I built python scripts to acquire over 2.5 million reviews from ratebeer.com and then sliced and diced the resulting information about breweries, beers, and their reviews for an Exploratory Data Analysis project.

The data wrangling and visualization work was done in R, and the report itself was generated with RMarkdown in RStudio, relying heavily on ggplot2 and dplyr.

The project rubric calls for a specific report format that has increasingly complex diagrams as you move through the report, so the best pictures (IMHO) are at the very end.

http://kateweber.com/portfolio/beer-reviews.html

The Ex-Cubs Factor, Revisited

cubs-pic

There’s a belief that a baseball team with more than three former Chicago Cubs is unable to win the World Series.  This paper is an attempt to analyze the actual facts from the Baseball Data Bank and see whether that’s in fact true.

Spoiler:  It’s not true.  The Pittsburgh Pirates are, in fact, the Worst Team Ever.

http://kateweber.com/portfolio/cubs-factor.html

The project was built in Python via an iPython Notebook, using the Seaborn plotting library to help visualize some of the statistical inferences.

Ticket Transfers

I was asked to help ITS understand how tickets move from service providers other than ITS into ITS.  In theory, all tickets should be rerouted to our Service Center or Neighborhood IT.  Was that true, or do some groups assign directly to ITS Tier 3?

Data was extracted from ServiceLink via a python script and then crunched in R.  The visualization is a Sankey diagram built with the rCharts library.

transfers

This first visualization answered the question: how do tickets come into ITS?  Answer:  just about everyone but LSA sends tickets to Neighborhood IT or the Service Center.

I got curious, though, and wondered what happened if I took the limiters out of the code and visualized *all* transfers?  The file is called ‘dogs-breakfast.html‘ for a reason, but on a large monitor, it is rich in information about how tickets move between our various support teams.

https://github.com/arfenarf/ticket-transfers

The Iceman Cometh

The Iceman Cometh is a key of the Midwest mountain biking scene, an even with hundreds of entries over thirty miles of course in unpredictable weather.  Entrants are sorted into waves based on their performance in previous races.  I was interested in understanding how the wave start impacted conditions along the course as faster riders overtook slower ones, so took the race data and visualized it first as a simple shiny app.  Once I colored each wave differently, processing time became very slow, so I took individual PNGs of each frame of the analysis and made a video instead.

I also wanted (very badly) to know how my performance was likely to compare to other women entered in the event so gathered results for women and faceted them year-over-year.  Vertical bars mark quartiles. (2014 was an appallingly bad weather year).icewomen

Data gathered from the Iceman site and mmba member bjbonner

Touring the Tour of Sufferlandria

ToS_Cover
An overview of a virtual cycling race, helping riders understand how much effort they expended; how this international event unfolded over time; and comparing their efforts to others’.  I also took an exploratory look at how event participants’ post-event performance compared to those of people who had not taken part.  This deserves more investigation.

Data sourced from http://www.trainerroad.com via python scripting, processed in R, published via shinyapps.io

https://arfenarf.shinyapps.io/Tour-Data-2016/

code: https://github.com/arfenarf/ToS-2016-Data

Maibock

Beer Name Maibock
Beer Style Maibock/Helles Bock
Brew Date 5/15/2016
Grain Bill Pilsner, Vienna
Hops Bill Hallertauer, Mittelfreuh
Yeast Oktoberfest (2-step)


Kegged for lagering 6/7/2016

FG 1.011

ABV 6.09%

Ingredient #1

The first, foremost thing you need in order to write a race report is, um, a race. And I finally, after 18 months of cowardice and lame excuses, have one to report. In order to make it happen, I knew I had to keep the pressure low – I decided to tackle a little sprint triathlon, one that was just a weekday night frolic, one where nobody knew me.

Of course, in order to do that, I had to either race with a paper bag on my head (impedes oxygen uptake like you wouldn’t believe, and totally not aero) or find a race that was about 4000 km away. So I did. Continue reading “Ingredient #1”